Analysis: Does a publication matter?

This may seem a strange question to ask for someone working in academia – of course a publication matters, especially if it is cited a lot. However, when it comes to publications about web resources, publications and citations in my opinion mainly serve as somewhat odd proxies on my CV for what really matters: the web resources themselves and how much they are used.

Still, one could hope that a publication about a new web resource would make people aware of its existence and thus attract more users. To analyze this, I took a look at the user statistics of our recently developed resource COMPARTMENTS:

COMPARTMENTS user statistics

Before publishing a paper about it, the web resource had less than 5 unique users per day. Our paper about the resource was accepted on January 26 in the journal Database, which increased the usage to about 10 unique users on a typical weekday. The spike of 41 unique users in a single day was due to me teaching on a course.

So what happened end of June that gave a more than 10-fold increase in the number of users from one day to the next? A new version of GeneCards was released with links to COMPARTMENTS. It seems safe to conclude that the peer-reviewed literature is not where most researchers discover new tools.

Commentary: The 99% of scientific publishing

Last week, John P. A. Ioannidis from Stanford University and Kevin W. Boyack and Richard Klavans from SciTech Strategies, Inc published an interesting analysis of scientific authorships. In the PLOS ONE paper “Estimates of the Continuously Publishing Core in the Scientific Workforce” they describe a small influential core of <1% of researchers who publish each and every year. This analysis appears to have caught the attention of many, including Erik Stokstad from Science Magazine who wrote the short news story “The 1% of scientific publishing”.

You would be excused to think that I belong to the 1%. I published my first paper in 1998 and have published at least one paper every single year since then. However, it turns out that the 1% was defined as the researchers who had published at least one paper every year in the period 1996-2011. Since I published my first paper in 1998, I belong to the other 99% together with everyone else who started their publishing career after 1996 or stopped their career before 2011.

Although the number 1% is making the headlines, the authors seem to be aware of the issue. Of the 15,153,100 researchers with publications in the period 1996-2011, only 150,608 published all 16 years; however, the authors estimate an additional 16,877 scientists published every year in the period 1997-2012. A similar number of continuously publishing scientists will have started their careers all the other years from 1998-2011. Similarly, they an estimated 9,673 researchers stopped their long continuous publishing career in 2010, and presumably all other years in the period 1996-2009. In my opinion, a better estimate is thus that 150,608 + 15*16,877 + 15*9,673 = 548,858 of the 15,153,100 authors have had or will have a 16-year unbroken chain of publications. That amounts to something in the 3-4% range.

That number may still not sound impressive; however, this in no way implies that most researchers do not publish on a regular basis. To have a 16-year unbroken chain of publications, one almost has to stay in academia and become a principal investigator. Most people who publish at least one article and subsequently pursue a career in industry or teaching will count towards the 96-97%. And that is no matter how good a job they do, mind you.

Announcement: EMBO practical course on protein interaction analysis in South Africa

I very much look forward to once again be part of the team of teachers behind the EMBO practical course “Computational analysis of protein-protein interactions: From sequences to networks”. This time it will for the first time take place on the African continent, more specifically in Cape Town, South Africa. The course will take place from September 23 – October 3 and the application deadline is July 23.

Please check the course website or the poster below for details.

Course poster

Job: Ph.D. stipend in systems biology and bioinformatics

I currently have an open position for a Ph.D. student in my group Cellular Network Biology. My group is part part of the Novo Nordisk Foundation Center for Protein Research (CPR) and is financially supported by the Faculty of Health and Medical Sciences, University of Copenhagen.

The project will primarily focus on developing new, improved methodologies for analysis of large-scale datasets, e.g. from mass spectrometry, in the context of protein interaction networks, protein localization, and expression. In doing so, the aim is both to test scientific hypotheses and to improve existing resources developed within the group, such as STRING and COMPARTMENTS. Candidates are thus expected to have experience with programming and statistics.

The closing date for applications is June 30, 2014. For further details refer to the job advert.

Commentary: GPU vs. CPU comparison done right

I have in earlier posts complained about how some researchers, through unfair comparisons, make GPU computing look more attractive than it really is.

It is thus only appropriate to also commend those who do it right. As part of some ongoing research, I came across a paper published in Journal of Chemical Information and Modeling:

Anatomy of High-Performance 2D Similarity Calculations

Similarity measures based on the comparison of dense bit vectors of two-dimensional chemical features are a dominant method in chemical informatics. For large-scale problems, including compound selection and machine learning, computing the intersection between two dense bit vectors is the overwhelming bottleneck. We describe efficient implementations of this primitive as well as example applications using features of modern CPUs that allow 20–40× performance increases relative to typical code. Specifically, we describe fast methods for population count on modern x86 processors and cache-efficient matrix traversal and leader clustering algorithms that alleviate memory bandwidth bottlenecks in similarity matrix construction and clustering. The speed of our 2D comparison primitives is within a small factor of that obtained on GPUs and does not require specialized hardware.

Briefly, the authors compare the speed of with which fingerprint-based chemical similarity searches can be performed on CPUs and GPUs. In contrast to so many others, the authors went to great lengths to give a fair picture of the relative performance:

  • Instead of using multiple very expensive Nvidia Tesla boards, they used an Nvidia GTX 480. This card cost roughly $500 when released and was the fastest gaming card available at the time.
  • For comparison, they used an Intel i7-920. This CPU cost approximately $300 when released and was a high-end consumer product.
  • They compared the GPU implementation of the algorithm to a highly optimized CPU implementation. The CPU implementation makes use of SSE4.2 instructions available on modern Intel CPUs and is multi-threaded to utilize all CPU cores.

The end result was that the GPU implementation gives a respectable but non-exceptional 5x speed-up over a pure CPU implementation. If one further takes into account that the GPU is probably 40% of the cost of the whole computer, this reduces to a 3x improvement in price-performance ratio.

The authors conclude:

In summary: GPU coding requires one to think of the hardware, but high-speed CPU programming is the same; spending time optimizing CPU code at the same level of architectural complexity that would be used on the GPU often allows one to do quite well.

I can only agree wholeheartedly.

Resource: The COMPARTMENTS database on protein subcellular localization

Together with collaborators in the groups of Seán O’Donoghue and Reinhard Schneider, my group has recently launched a new web-accessible database named COMPARTMENTS.

COMPARTMENTS unifies subcellular localization evidence from many sources by mapping all proteins and compartments to their STRING identifiers and Gene Ontology terms, respectively. We import curated annotations from UniProtKB and model organism databases and assign confidence scores to them based on their evidence codes. For human proteins, we similarly import and score evidence from The Human Protein Atlas. COMPARTMENTS also uses text mining to derive subcellular localization evidence from co-occurrence of proteins and compartments in Medline abstracts. Finally, we precompute subcellular localization predictions with the sequence-based methods WoLF PSORT and YLoc. For further details, please refer to our recently published paper entitled “COMPARTMENTS: unification and visualization of protein subcellular localization evidence”.

To provide a simple overview of all this information, we visualize the combined localization evidence for each protein onto a schematic of an animal, fungal, or plant cell:

COMPARTMENTS NR3C1

COMPARTMENTS COX1

COMPARTMENTS PSAB

You can click any of the three images above to go to the COMPARTMENTS web resource. To facilitate use in large-scale analyses, the complete datasets for major eukaryotic model organisms are available for download.

Announcement: PTMs in Cell Signaling conference

Two years ago, I was one of the organizers of the 2nd Copenhagen Bioscience Conference entitled PTMs in Cell Signaling. I think it is fair to describe it as a highly successful meeting, and it is my great pleasure to announce that we will be organizing a second meeting on the topic September 14-18, 2014.

CBC6 poster

My co-chairs Jeremy Austin Daniel, Michael Lund Nielsen, and Amilcar Flores Morales have managed to put together the following excellent lineup of invited speakers:

Alfonso Valencia, Chris Sander, David Komander, Gary Nolan, Genevieve Almouzni, Guillermo Montoya, Hanno Steen, Henrik Daub, John Blenis, John Diffley, John Tainer, Karolin Luger, Marcus Bantscheff, Margaret Goodell, Matthias Mann, Michael Yaffe, Natalie Ahn, Pedro Beltrao, Stephen Elledge, Tanya Paull, Tony Hunter, Yang Shi, Yehudit Bergman, and Yosef Shiloh.

All conference expenses are covered, which means that there will be no registration fee and no expenses for accommodation or food. You will have to cover your own travel expenses, though.

Participants will be selected based on abstract submission, which is open until June 9, 2014. For more information please see the conference website.

Commentary: Are other women a woman’s worst enemies in science?

It is clear that in science, we have a gender bias among leaders. It is my impression that most people think this is due to a combination of men and women having different priorities in life and high-ranking male professors favoring their own gender. Conversely, I have never heard anyone dare to suggest that women may be their own worst enemies in this context.

Benenson and coworkers from Emmanuel College have just published an interesting study in Current Biology on collaborations between full professors and assistant professors entitled “Rank influences human sex differences in dyadic cooperation”.

By tabulating the joint publications, they found 76 same-sex publications from male full professors, which should be compared to a random expectation of 61 such publications. By contrast they found only 14 same-sex publications from female full professors with the random expectation being 29. In other words, whereas male full professors collaborated 25% more with male assistant professors than expected, female full professors collaborated more than 50% less with female assistant professors than expected. The authors conclude:

Our results are consistent with observations suggesting that social structure takes differing forms for human males and females. Males’ tendency to interact in same-gender groups makes them more prone to cooperation with asymmetrically ranked males. In contrast, females’ tendency to restrict their same-gender interactions to equally ranked individuals make them more reluctant to cooperate with asymmetrically ranked females.

There is, in other words, a bias towards high-ranking professors of both genders to preferentially collaborate with lower-ranking male professors as opposed to lower-ranking female professors. If anything, that bias appears to be stronger in case of high-ranking female professors than high-ranking male professors.

Commentary: Coffee, a prerequisite for research?

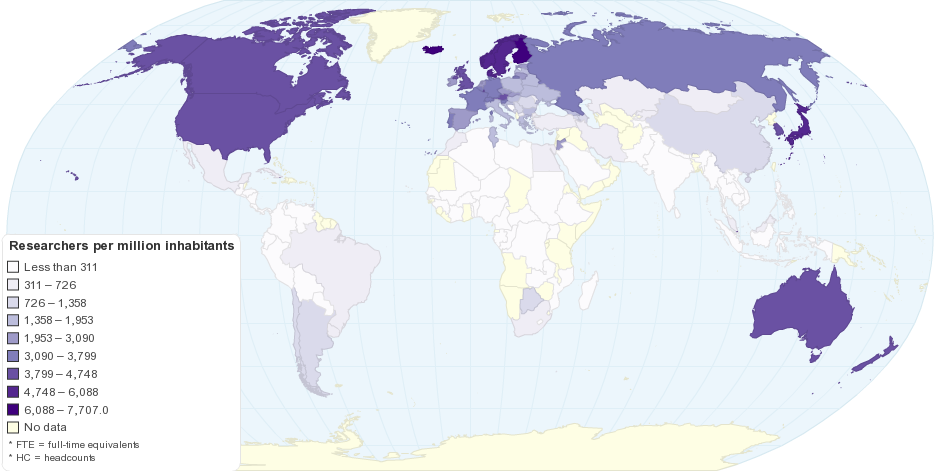
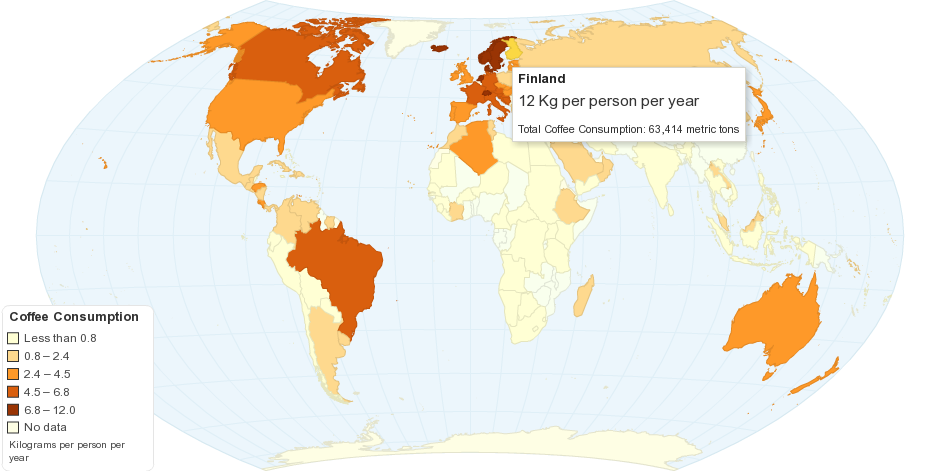
Yesterday, I stumbled upon two links that I found interesting. The first was the map-based data visualization blog post 40 Maps That Will Help You Make Sense of the World, in which maps 24 and 28 hint at a correlation (click for larger interactive versions):

Number of Researchers per million inhabitants by Country

Current Worldwide Annual Coffee Consumption per capita

The first map shows the number of researchers per million inhabitants in each country. The second map shows the number of kg coffee consumed per capita per year. As ChartsBin allows you to download the data behind each map, I did so and produced a scatter plot that confirms the strong correlation (click for larger version):

coffee_vs_researchers

This confirms my view that the coffee machine is the most important piece of hardware in a bioinformatics group. Bioinformaticians with coffee can do work even without a computer, but bioinformaticians without coffee are unable to work, no matter how good computers they have.

One should of course be careful to not jump to conclusions about causality based on correlation. This leads me to the second link: a new study published in Nature Neuroscience, which shows that Post-study caffeine administration enhances memory consolidation in humans.

I optimistically await a similar study confirming the correlation between Chocolate Consumption, Cognitive Function, and Nobel Laureates published last year in New England Journal of Medicine.

Exercise: Hands-on text mining of protein-disease associations

Background

In this exercise you will be processing two sets of documents on prostate cancer and schizophrenia, respectively. You will use a program called tagdir along with a pre-made dictionary of human protein names to identify proteins relevant for each disease and to find a protein that links the two diseases to each other.

The software and data files required for this exercise is available as a tarball. You will need to know how to compile a C++ program to run this exercise; also, the C++ program requires Boost C++ Libraries.

How to run the tagger

To execute the tagger program, you need to run a command with the following format:

tagdir dictionary_file blacklist_file documents_directory > matches_file

The argument dictionary_file should be the name of a tab-delimited file containing the dictionary of names to be tagged in the text. For this exercise you will always want to use the file human_proteins.tsv.

The argument blacklist_file should be the name of a tab-delimited file containing the exact variants of names that should not be tagged despite the name being in the dictionary. To tag every variant of every name, you can simply use an empty file (empty.tsv), but you will also be making your own file later as part of the exercise.

The argument documents_directory should be the name of a directory containing text files with the documents to be processed. For this exercise two such directories will be used, namely prostate_cancer_documents and schizophrenia_documents.

Finally you give a name for where to put the tab-delimited output from the tagger (matches_file). You can call these files whatever you like, but descriptive names will make your life easier, for example, prostate_cancer_matches.tsv.

When running the tagger on one of the two directories of documents, you should expect the run to take approximately 2 minutes.

File formats

The tagger program requires the input to be in very specific formats. The dictionary_file must be a tab-delimited file that looks as follows:

263094 ABCA7
285238 ABCC3
354995 ABCG1
268129 ABHD2
233710 ACADL

The first column must be a number that uniquely identifies the protein in question. In human_proteins.tsv the numbers used are the ENSP identifers from Ensembl, with the letters ENSP and any leading zeros removed. The second column is a name for the protein. If a protein has multiple names, there will be several lines, each listing the same number (i.e. the same protein) but a different name for it.

The blacklist_file must similarly be a tab-delimited file in which each line specifies a specific variant of a name and whether it should be blocked or not:

ACP t
ACS t
ACTH f
activin f
act t

The letter “t” in the second column means TRUE (i.e. that the variant should be blocked) and “f” means FALSE (i.e. that it should not be blocked). The file above would thus block ACP, ACS, and act but not ACTH and activin. Because variants are by default not blocked, you in principle only need to add lines with “t”; however, the lines with “f” can be very useful to keep track at which variants you have already looked at and actively decided not to block, as opposed to variants that are not blocked because you have not looked at them.

The output of the tagger is also tab-delimited, each line specifying a possibly meaning of a match in a document:

7478532.txt 254 256 TSG 262120
7478532.txt 254 256 TSG 416324
7478532.txt 595 597 LPL 309757
7478532.txt 595 597 LPL 315757
7478532.txt 658 661 NEFL 221169
7478532.txt 736 738 LPL 309757
7478532.txt 736 738 LPL 315757

The first column tells the name of the file (the numbers are in our case the PubMed IDs of the abstracts). The next two columns specify from which character which character there is a match. The fourth column shows which string appeared in that place in the document. The fifth column specific which protein this could be (i.e. the Ensemble protein number). The first line in the output above thus means that the document 7478532.txt from character 254 to character 256 says TSG, which could mean the protein ENSP00000262120. The second line shows that it alternatively could be ENSP00000416324.

Making a blacklist

As you will see if you run the tagdir using an empty blacklist_file, a simple dictionary matching approach leads to very many wrong matches unless it is complemented by a good list of name variants to be blocked.

To identify potential name variants that you might want to put on the black list, you will want to count the number of occurrences of each and every name variant in an entire corpus of text. A very helpful UNIX command for doing this based on a matches_file (produced by tagdir) is:

cut -f 4 matches_file | sort | uniq -c | sort -nr | less

What it does is first cut out the exact name variants in column 4 of your matches file (cut -f 4), sort them so that multiple copies of the same variant will be right after each other (sort), count identical adjacent lines (uniq -c), sort that list reverse numerical so that the highest counts come first (sort -nr), and show the resulting in a program so that you can scroll through it (less).

The next step is to simply go through the most frequently occurring name variants and manually decide which ones are indeed correct protein names that just occur very frequently, and which ones occur very frequently because they mean something entirely different than the protein. The latter should be put on your blacklist.

Once you have produced a blacklist, you can rerun the tagdir command and you will get much less output because vast numbers of false positive matches have been filtered away. You will find that adding just the worst few offenders to the blacklist will help much; however, as you go further down the list the effort spent on inspecting more names gives diminishing returns.

Finding proteins associated to a disease

Making a very good blacklist would take too long for this exercise. For the following exercise it is thus recommended that you use the provided file blacklist_10.tsv, which we have provided.

The goal is now to produce a top-20 list of proteins that are most often mentioned in papers about prostate cancer. To achieve this, you need to rerun the tagging of human proteins in the prostate cancer documents, making use of the above mentioned blacklist. To extract a top-20, you can use a command similar to the one used for create the list of most commonly appearing name variants.

Find a protein linked to both diseases

Starting from the top-20 list of prostate cancer proteins, find one or more proteins that are also frequently mentioned in papers on schizophrenia. To do so, you will need to tag also the set of documents on schizophrenia, count the number of mentions of every protein, and check the count of every protein on the top-20 list for prostate cancer in the schizophrenia set.