Monthly Archives: February 2008

Resource: The BuzzCloud visualization of buzzwords

“Oh, you work on systems biology? So do I!”

New buzzwords to describe scientific disciplines and technologies seem to pop up every year. For the fun of it, I have developed a small web resource, BuzzClouds, that provides a visual overview of the latest buzzwords in biomedicine.

Without destroying your weekend with mathematical formulas, here is how the BuzzCloud selection and visualization method works:

  • A list of potential buzzwords is constructed by extracting all one- and two-word phrases ending on -ics, -ology, -omy, -phy, -chemistry, -medicine, or -sciences. These endings were select to get buzzwords that correspond to scientific disciplines and technologies.
  • The potential buzzwords are ranked according to a score that takes into account their frequencies within the past year and within the preceding decade (for details see this review article). To get a high score, a buzzword must be both frequent and new. The top-50 buzzwords are included in the cloud.
  • The size of each buzzword is proportional to the logarithm of its frequency during the past year. Common buzzwords are thus large where as rare buzzwords are small.
  • The brightness of each buzzword shows the frequency of the buzzword within the past year relative to the preceding decade. New buzzwords are thus bright whereas the older ones are darker.
  • Finally, each buzzword is assignd a tint that goes from yellow via white to cyan based on how often it occurs in scientific journals (yellow) as opposed to medical journals (cyan).

When run for the year 2007, the end result looks like this (BuzzClouds for other years are available from the web resource):

50 buzzwords identified based on Medline abstracts from 2007

I think the method does a pretty decent job despite the occasional mistakes such as nice technology and timely topics. In terms of scientific buzzwords, quantitative proteomics is booming, systems biology still hot although it is getting a bit long in the tooth, and synthetic biology is rapidly gaining popularity. And nanotechnology seems to be popular within the medical domain, giving rise to buzzwords like nanomedicine and nanotherapeutics.

Maybe I should write a buzzword-compliant, interdisciplinary grant application that combines click chemistry and synthetic biology to develop novel nanotherapeutics.

WebCiteCite this post

Analysis: Cell-cycle phenotypes and regulation, part 2

I have previously blogged about the relationship between cell-cycle phenotypes and regulation in human as well as budding yeast. I was thus excited to see the new RNAi study on cell-cycle phenotypes by Rines and coworkers that was published in Genome Biology two days ago. The title of their paper is “Whole genome functional analysis identifies novel components required for mitotic spindle integrity in human cells”, and the abstract reads as follows:

Background

The mitotic spindle is a complex mechanical apparatus required for accurate segregation of sister chromosomes during mitosis. We designed a genetic screen using automated microscopy to discover factors essential for mitotic progression. Using a RNAi library of 49,164 double-stranded (ds)RNAs targeting 23,835 human genes, we performed a loss-of-function screen looking for siRNAs that arrest cells in metaphase.

Results

Here we report the identification of genes that when suppressed result in structural defects in the mitotic spindle leading to bent, twisted, monopolar or multipolar spindles and cause a cell cycle arrest. We further described a novel analysis methodology for large-scale RNAi datasets which relies upon supervised clustering of these genes based on gene ontology (GO), protein families, tissue expression and protein-protein interactions.

Conclusions

This approach was utilized to functionally classify the identified genes in discrete mitotic processes. We confirmed the identity for a subset of these genes and examined more closely their mechanical role in spindle architecture.

The screen identified a set of 226 genes that when suppressed lead to spindle-related cell-cycle phenotypes. Using the name-mapping files from STRING, I was able to map 175 of them to the set of genes used in my other cell-cycle analyses. The results presented below are all based on this set of 175 genes.

To my surprise, Rines and coworkers did not compare their results to the earlier phenotypic screen published by Mukherji et al. in PNAS. Since I had already mapped this dataset onto the same gene set, it was easy to make a comparison of the new phenotype data from Rines et al. and the eight phenotypic categories defined by Mukherji et al.:

Category Description Overlap Significance
1 G1 small nuclear area 2/116 n.s.
2 G1 2/117 n.s.
3 S 1/61 n.s.
4 S + G2/M 4/59 P < 0.002; FDR < 1%
5 G2/M large nucleus 5/200 P < 0.019; FDR < 5%
6 G2/M 4/259 n.s.
7 G2/M + endoduplication 1/52 n.s.
8 Cytokinesis 3/36 P < 0.003; FDR < 1%

The statistical significance of the overlap was assessed using Fisher’s exact test and the false discovery rate (FDR) was calculated using the Benjamini-Hochberg method. As can be seen, the agreement between the two studies is very poor. Nonetheless, it is reassuring that the largest overlap (>8%) is observed for category 8, since spindle defects should be expected to result in problems during cytokinesis.

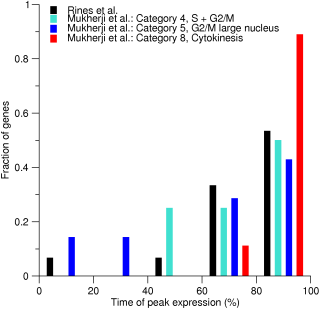
I also looked into the transcriptional and post-translational regulation of the 175 genes. The cell-cycle microarray study by Whitfield and coworkers covered 124 of the genes, 15 of which are periodically expressed (P < 0.002; Fisher’s exact test). Plotting the distribution of peak times for these genes confirms the observation by Rines et al. that the genes tend to be expressed around the G2/M transition and during M phase:

Peak time distributions for human genes identified by Rines et al. and Mukheriji et al.

As should be expected, the peak-time distribution for the genes identified by Rines et al. is in agreement with the corresponding distributions for categories 4, 5, and 8 from Mukherji and coworkers.

Comparison with a set of 985 phosphoproteins identified in low-throughput studies (obtained from Phospho.ELM) shows that the proteins products encoded by the 175 genes are preferentially phosphorylated (P < 0.001; Fisher’s exact test). This result is confirmed by comparisons with large mass-spectrometry studies (P < 0.03; Fisher’s exact test) and CDK substrates predicted by NetPhosK (P < 0.05; Fisher’s exact test).

Finally, I analyzed the protein products encoded by the 175 genes for degradation signals. 22 of them contain a strong D-box motif (P < 0.03; Fisher’s exact test) and 28 contain a KEN-box motif (P < 0.002; Fisher’s exact test). By contrast, the gene products identified by Rines et al. display no overrepresentation of PEST degradation signals. This makes sense since proteins with D-box and/or KEN-box motifs are polyubiquitinated by the anaphase-promoting complex (APC) during late M phase, which targets them for degradation by the proteasome.

In summary, Rines and coworkers has identified a set of genes that show weak but significant overlap with some of the phenotypic categories defined by Mukherji et al., with periodically expressed genes identified based on microarray data from Whitfield et al., with known and predicted phosphoproteins, and with predicted degradation signals. All of the results are consistent with the majority of the 175 genes functioning during G2/M and early M phase.

WebCiteCite this post

Analysis: Evolution of transcription-factor binding and cell-cycle-regulated transcription

Together with collaborators in Søren Brunak’s group, I have earlier published a comparative study on eukaryotic cell-cycle regulation. In the supplement and earlier papers, we presented benchmarks that documented the sensitivity with which periodically expressed genes can be identified based on microarray expression data. We thereby showed that the poor evolutionary conservation of transcriptional cell-cycle regulation is not an artifact of individual gene lists being unreliable.

However, there is a more direct test that we did not think of at the time, namely to check if the changes in periodic transcription agree with the binding of cell-cycle transcription factors in each organism. The first step is to select two organisms (organism 1 and organism 2) and extract two sets of genes: 1) cycling genes from organism 1 with non-cycling orthologs in organism 2 and 2) non-cycling genes from organism 1 with cycling orthologs in organism 2. Next, Fisher’s exact test is used to determine if targets of cell-cycle transcription factors are overrepresented in the first set relative to the second. This procedure is equivalent to the test for coevolution between transcriptional and postranslational regulation (see Jensen et al. (2006) for details).

I used the procedure to perform all pairwise tests for Homo sapiens, Saccharomyces cerevisiae, Schizosaccharomyces pombe, and Arabidopsis thaliana. For each choice of organism 1, I used the same set of cell-cycle transcription-factor targets also used for the original benchmarks. The table below sumarizes the results of the statistical tests; the rows specify organism 1 and columns specify organism 2:

  H. sapiens S. cerevisiae S. pombe A. thaliana
H. sapiens   P < 10-5 P < 10-9 P < 10-6
S. cerevisiae P < 10-8   P < 10-7 P < 0.01
S. pombe P < 10-4 n.s.   P < 0.01
A. thaliana P < 0.09 n.s. P < 10-4  

For most of the pairwise organism comparisons, the expected coevolution of transcription factor binding and cell-cycle-regulated transcription is supported by the statistical test. Benjamini-Hochberg correction for multiple testing was thus not performed as it would change the p-values only marginally (by a factor of 4/3 to be exact). Apart from the S. pombe vs. S. cerevisiae comparison, the weak correlations all involve A. thaliana for which only very limited microarray expression data is available.

This analysis shows that the differences in cell-cycle-regulated transcription (as measured by microarrays) are consistent with the available data on transcription-factor binding. This provides direct evidence that the poor conservation of cell-cycle regulation observed between eukaryotes is due to genuine, biological differences.

WebCiteCite this post

Commentary: We apologize

Attila Chordash over at “PIMM – Partial immortalization” discovered that Proteomics have now changed the abstract of the infamous paper by Warda and Han to be an apology to their readership:

Proteomics apologizes

While I am pleased to see this public apology from the publisher, the retraction is still only based on “a substantial overlap of the content of this article with previously published articles in other journals”. That is a euphemism for “the authors copied four entire pages of text from sources that were not cited”. However, I am concerned that this apology – like the press release from Proteomics – ignores the central question: how did the manuscript make it through peer review?

I was a bit surprised to see an apology being published via PubMed, but a quick search revealed that Proteomics is far from the only journal to apologize to their readers in this way. In fact, a systematic count of the abstracts mentioning the words “apologise(s)” or “apologize(s)” has increased exponentially over the past decade (note the logarithmic scale):

Exponential increase in the number of apologies

The number shown for 2008 is an extrapolation based on the first six weeks; if the apologies keep coming at the current rate, there will be 32 by the end of the year. The line shows an exponential fit of the data points from 1999 to 2007. The doubling time for the number of apologies is just 3 years whereas the number of papers doubles only every 22 years. If these trends continue, there will be more apologies than papers published from the year 2067 and onwards. I apologize for the extrapolation.

WebCiteCite this post

Analysis: Cell-cycle phenotypes and regulation

In 2006 the Schultz lab at the Scripps Research Institute published a paper in PNAS called “Genome-wide functional analysis of human cell-cycle regulators”. The abstract reads:

Human cells have evolved complex signaling networks to coordinate the cell cycle. A detailed understanding of the global regulation of this fundamental process requires comprehensive identification of the genes and pathways involved in the various stages of cell-cycle progression. To this end, we report a genome-wide analysis of the human cell cycle, cell size, and proliferation by targeting >95% of the protein-coding genes in the human genome using small interfering RNAs (siRNAs). Analysis of >2 million images, acquired by quantitative fluorescence microscopy, showed that depletion of 1,152 genes strongly affected cell-cycle progression. These genes clustered into eight distinct phenotypic categories based on phase of arrest, nuclear area, and nuclear morphology. Phase-specific networks were built by interrogating knowledge-based and physical interaction databases with identified genes. Genome-wide analysis of cell-cycle regulators revealed a number of kinase, phosphatase, and proteolytic proteins and also suggests that processes thought to regulate G1-S phase progression like receptor-mediated signaling, nutrient status, and translation also play important roles in the regulation of G2/M phase transition. Moreover, 15 genes that are integral to TNF/NF-κB signaling were found to regulate G2/M, a previously unanticipated role for this pathway. These analyses provide systems-level insight into both known and novel genes as well as pathways that regulate cell-cycle progression, a number of which may provide new therapeutic approaches for the treatment of cancer.

I recently wrote a commentary about how phenotypes in yeast agree remarkably well with the just-in-time assembly hypothesis for cell-cycle regulation of protein complexes. I thus decided to also compare the dataset on cell-cycle phenotypes for human genes with the cell-cycle microarray expression data published in 2002 by Whitfield and coworkers.

Using the mapping files from the STRING database, I was able to automatically map 741 of the 1152 genes with cell-cycle phenotypes to the set of 12,097 genes for which we have cell-cycle microarray expression data. Of the 741 genes, 55 are among the a of 600 periodically expressed genes identified in a reanalysis of the data from Whitfield and coworkers. This is just shy of 50% more than what would be expected by random chance (P < 0.001; Fisher’s exact test).

The authors divided the cell-cycle mutants into eight classes. Repeating the above analysis for each of these categories separately revealed that genes with phenotypes related to S-phase and cytokinesis were significantly overrepresented among the 600 periodically expressed genes (FDR < 0.05; Fisher’s exact test and Benjamini-Hochberg correction for multiple testing). The other categories did not yield statistically significant results.

To look at the temporal regulation of transcription in more detail, I plotted the distribution of peak times (the point in the cell cycle when a gene is maximally expressed) for the periodically expressed genes from each of the eight phenotypic categories:

Peak time distributions for human genes with cell-cycle-related phenotypes

For the periodically expressed genes that display a cell-cycle phenotype in the screen by Schultz and coworkers, the observed phenotypes agree with the time of peak expression. In particular, the genes with cytokinesis-related phenotypes are all expressed shortly before the time of cell division (cytokinesis). Most of the periodically expressed genes with phenotypes related to S phase are similarly expressed during S phase (roughly 50-70% into the cell cycle), genes with phenotypes related to the G2/M transition also tend to be expressed during the appropriate phase of the cell cycle.

In summary, these results support the view that cell-cycle-regulated genes are expressed shortly before their time of action, despite the fact that regulation also takes place at the protein level. It also confirms that many genes with cell-cycle function are not subject to transcriptional cell-cycle regulation.

WebCiteCite this post

Update: Not treasure but buried

There is good news regarding the Warda and Han scandal. After numerous researchers including myself emailed the Editor in Chief of Proteomics, Michael J. Dunn, the paper is now listed as retracted. I am pleased to see that the editorial team of Proteomics has acted swiftly against plagiarism.

Edit: The last author of the paper, Jin Han, has written a reply to PZ Myers. According to the email, he has himself contacted the editorial office and requested that the paper be retracted. I am still looking forward to hearing an official explanation from Proteomics of how this paper got accepted in the first place.

Edit: Michael J. Dunn has emailed me a copy of the approved press release from Proteomics that announces the retraction of the paper by Warda and Han. The only explanation offered is that the paper made it through peer review due to “human error” – or in other words “someone did something wrong”. I would have been truly worried if a paper like this had been accepted without human error being involved. I hope that Proteomics will provide the scientific community with more details when they have completed the internal investigation of the incident.

WebCiteCite this post

Analysis: The law of diminishing returns

The law of diminishing returns is a well known concept in economics. Highly simplified, it states that as you invest more, the overall return on investment increases at a declining rate. I wondered if this principle applies to biomedical research.

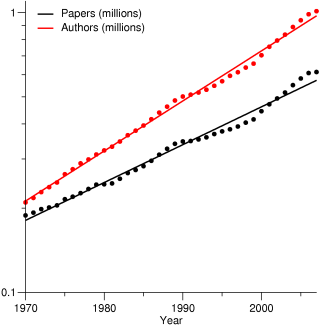
I thus wrote a small script to parse the Medline database and count for each year 1) the number of new papers published, 2) the number of authors that published at least one paper, and 3) the total number of (co-)authorships. The plot below shows the number of new papers and the number of active authors for each year since 1970:

Exponential growth in the number of papers and authors

Few scientists – if any – will be surprised to see that the rate of publication and the number of active publishing scientists have increased exponentially. However, it is slightly disconcerting that the number active authors doubles every 17 years whereas the number of papers per year doubles only every 22 years.

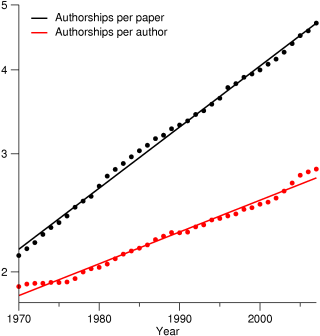
To look deeper into this, I plotted as function of time the average number of coauthors per paper and the average number of papers coauthored by each active author:

Exponential increase in the number of authorships per paper and per author

These two measures also appear to increase exponentially. However, the number of coauthors per paper is increasing considerably faster than the number of papers coauthored by each author per year. The estimated doubling times are 33 years for the number of coauthors per paper and 63 years for the number of papers coauthored. This suggests that the productivity of biomedical scientists, measured in terms of publications, has decreased.

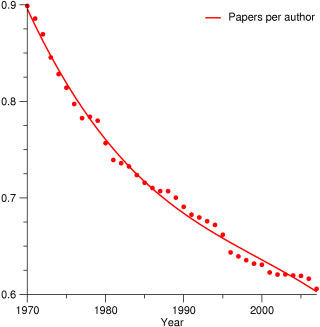
A more direct way to show this is to plot the ratio between the number of papers published each year and the number of authors on them (note that the y-axis does not start at zero):

The productivity in terms of papers is decreasing

The fact is that the number of papers produced per researcher per year has dropped by roughly one third since 1970. However, there could be many reasons for this:

  • Have we simply become lazy?
  • Has the bar been raised for what is considered the Least Publishable Unit?
  • Are large collaborations less efficient than smaller projects?
  • Do we spend more time on bureaucracy and less time on science?
  • Or are we left with the hard questions because the easy ones have all been answered?

My guess is that the last three reasons all play important roles. What do you think?

WebCiteCite this post

Commentary: Neither buried nor treasure

This post might be considered off topic since it is about a paper that is unfortunately neither buried nor treasure. I would rather describe it as “organic fertilizer that has come into contact with a rotary air-circulation device”.

The paper that I will dissect is “Mitochondria, the missing link between body and soul: Proteomic prospective evidence” by Mohamad Warda and Jin Han. This review is at the time of writing published in electronic form by the journal Proteomics (ISI impact factor 5.735). It was aptly described as “A baffling failure of peer review” by PZ Myers on his blog Pharyngula, which led to a flash mob of researchers (including me) quickly identifying several flaws, any one of which should in my view be sufficient to cause the journal to retract the paper:

  • Warda and Han twice suggest that mitochondria provide a link between body and soul, but they never provide any argument for this.
  • They claim to present data that disproves the accepted endosymbiotic theory for the origin of mitochondria. But in reality they present no such evidence.
  • They promise to replace this theory by “a more realistic alternative”. The alternative turns out to be “a mighty creator”, or in other words Intelligent Design.
  • To support these truly remarkable claims, the authors misrepresent the results of cited references. Some of these references are even completely unrelated to the topic at hand.
  • Entire sections or paragraphs of the paper are plagiarism of other researcher’s papers and from the website of another group. Not only is this material not presented as quotations, the sources are not even cited.
  • Finally, numerous sentences have been copied verbatim from the cited sources. This may be partly excused by the authors borrowing better English, but I nonetheless consider it an unacceptable practice especially in reviews.

Note how I use block quotations below to show which parts are not my own words. That is what Warda and Han should have done to avoid their biggest problem: being accused of plagiarism. Let us start by looking at the first sentence of the abstract:

Mitochondria are the gatekeepers of the life and death of most cells that regulate signaling, metabolism, and energy production needed for cellular function.

This sentence is identical to the first sentence on the webpage of a competing group, namely the Mitochondrial Research & Innovation Group at University of Rochester Medical Center. The rest of the paragraph from the webpage can be found later in the paper by Warda and Han:

Recent scientific studies show that mitochondrial dysfunction is more commonplace than previously thought and that substantial mitochondrial involvement is present in many acute and chronic diseases. Mitochondrial dysfunction is now implicated in a range of human diseases, including aging, diabetes, atherosclerosis, heart failure, myocardial infarction, stroke and other ischemic-reperfusion injuries, neurodegenerative diseases including Alzhiemer’s and Parkinson’s diseases; cancer, HIV; sepsis and trauma with multiorgan dysfunction or failure. Some rare mitochondria diseases (e.g., MELAS, Kearns-Sayre) are associated with large deletions in the mitochondrial genome. More recently, the so-called OXPHOS diseases that reflect a limited capacity to produce the energy needed to respond to normal stress conditions.

However, most of the plagiarized material is not from webpages; it is from peer-reviewed papers of other researchers. For example, the two paragraph below appear to originate from the paper “Peroxisome Proliferator-Activated Receptor gamma Coactivator-1 (PGC-1) Regulatory Cascade in Cardiac Physiology and Disease” published by Brian N. Finck and Daniel P. Kelly in the journal Circulation:

Emerging evidence supports the notion that derangements in mitochondrial energy metabolism contribute to cardiac dysfunction [186]. For example, human mitochondrial DNA mutations resulting in global impairment in mitochondrial respiratory function cause hypertrophic or dilated cardiomyopathy and cardiac conduction defects [187, 188]. Mutations in nuclear genes encoding mitochondrial fatty acid oxidation enzymes may also manifest as cardiomyopathy [189, 190]. Interestingly, cardiomyopathies resulting from inborn errors in mitochondrial fatty acid oxidation enzymes are often provoked by physiological or pathophysiological conditions that increase dependence on fat oxidation for myocardial ATP production such as prolonged exercise or fasting associated with infectious illness [190,191].

A causal relationship between mitochondrial dysfunction and cardiomyopathy is also evidenced by several genetically engineered mouse models. Targeted deletion of the adenine nucleotide translocator 1, which transports mitochondrially generated ATP to the cytosol, leads to mitochondrial dysfunction and cardiomyopathy [192]. Mice with cardiac-specific deletion of the transcription factor of activated mitochondria, which controls transcription and replication of the mitochondrial genome, also exhibit marked impairments in mitochondrial metabolism, severe cardiomyopathy, and premature mortality [193]. Cardiomyopathy and/or conduction defects are also observed in several mouse models with targeted deletion of specific fatty acid oxidation enzymes [194, 195].

I discovered these plagiarized sections myself, but they only scratch the surface and pale in comparison to the amount of copied material identified by others. I should make clear that I do not blame the reviewers for not discovering this; their job is to check the scientific quality of the material presented, not to detect fraudulent or plagiarized material.

The editor and the reviewers are not off the hook, though. Interspersed between the sensible review material, much of which has been copied from elsewhere, there are a few sections that are “a mélange of truths, half-truths, quarter-truths, falsehoods, non sequiturs, and syntactically correct sentences that have no meaning whatsoever” (to use the words of Alan Sokal).

The first of these is the following sentence from the abstract:

These data are presented with other novel proteomics evidence to disprove the endosymbiotic hypothesis of mitochondrial evolution that is replaced in this work by a more realistic alternative.

Clearly the editors and the reviewers should have examined the evidence for such an exceptional claim. The “evidence” that supposedly disproves the serial endosymbiotic theory (SET) of mitochondrial evolution is presented in section 3.4, which after explaining the theory makes the following baffling statement:

The proof of SET was based on the parallel connection between plant mitochondrial and phage T4 genome replication [107, 108] …

This is simply not true. First, the scientific method can never prove a theory. Second, the similarity between the replication of mitochondrial and phage T4 genomes is completely irrelevant with respect to the endosymbiotic origin of mitochondria. Third, reference 108 is about chloroplasts and not mitochondria.

Next, the authors try to convince the reader that people are still debating the validity of the endosymbiotic theory:

Therefore, the debates concerning the mitochondrial endosymbiotic hypothesis recently terminated with many questions still left unanswered [111].

Reference 111 is a paper in Cellular Immunology by Gray and coworkers with the title “Modulation of CD8+ T cell avidity by increasing the turnover of viral antigen during infection”. It has nothing to do with the evolution of mitochondria.

The authors go on to recite the well known facts that the vast majority of mitochondrial proteins are encoded by nuclear genes and that most bacterial genes do not match within the mitochondrial DNA. They then give a long description of how tightly integrated mitochondria are with the rest of the cell and use the tired old argument of irreducible complexity to dismiss the endosymbiotic theory. Needless to say, the authors have what they consider to be a more realistic explanation:

Alternatively, instead of sinking in a swamp of endless debates about the evolution of mitochondria, it is better to come up with a unified assumption that all living cells undergo a certain degree of convergence or divergence to or from each other to meet their survival in specific habitats. Proteomics data greatly assist this realistic assumption that connects all kinds of life. More logically, the points that show proteomics overlapping between different forms of life are more likely to be interpreted as a reflection of a single common fingerprint initiated by a mighty creator than relying on a single cell that is, in a doubtful way, surprisingly originating all other kinds of life.

In other words: “God did it”. If I can read correctly, the authors here reject not only the endosymbiotic origin of mitochondria but also the common ancestry of eukaryotes. And as if this was not enough, the authors end the paper with the following bold conclusion that also explains the mysterious title of the paper:

We realize so far that mitochondria could be the link between the body and this preserved wisdom of the soul devoted to guaranteeing life.

I am speechless. As anyone who knows me can attest, that very rarely happens.

Edit: The paper has now been retracted, but there are still many open questions as to how it got accepted in the first place.

WebCiteCite this post

Commentary: Does just-in-time assembly of protein complexes explain phenotypes?

Beginning of this year Ben Lehner’s lab published a beautiful study in BMC Systems Biology with the title “A simple principle concerning the robustness of protein complex activity to changes in gene expression”. The abstract reads:

Background

The functions of a eukaryotic cell are largely performed by multi-subunit protein complexes that act as molecular machines or information processing modules in cellular networks. An important problem in systems biology is to understand how, in general, these molecular machines respond to perturbations.

Results

In yeast, genes that inhibit growth when their expression is reduced are strongly enriched amongst the subunits of multi-subunit protein complexes. This applies to both the core and peripheral subunits of protein complexes, and the subunits of each complex normally have the same loss-of-function phenotypes. In contrast, genes that inhibit growth when their expression is increased are not enriched amongst the core or peripheral subunits of protein complexes, and the behaviour of one subunit of a complex is not predictive for the other subunits with respect to over-expression phenotypes.

Conclusions

We propose the principle that the overall activity of a protein complex is in general robust to an increase, but not to a decrease in the expression of its subunits. This means that whereas phenotypes resulting from a decrease in gene expression can be predicted because they cluster on networks of protein complexes, over-expression phenotypes cannot be predicted in this way. We discuss the implications of these findings for understanding how cells are regulated, how they evolve, and how genetic perturbations connect to disease in humans.

It struck me that these observations can all be explained by the just-in-time assembly model for temporal regulation of protein complex assembly, which I developed together with members of Søren Brunak’s group. For a long explanation and discussion of the model see our paper “Evolution of Cell Cycle Control: Same Molecular Machines, Different Regulation”. For the short version see the figure below, which shows how cell-cycle regulation of just a single subunit is sufficient to control when during the cell cycle a complex is active (click to enlarge):

The just-in-time assembly hypothesis

What will happen if you knock down the expression of one subunit of a complex? The maximal number of complete complexes that can be assembled will be reduced, irrespective of whether the subunit is dynamic or static. Whether this results in a given phenotype depends on the function of the complex. However, the effect should in principle be the same for different subunits of the same complex, which is exactly what Lehner and coworkers observed.

What if you instead overexpress one subunit of a complex? For a static subunit it should not really matter; the maximal number of complete complexes that can be assembled is unchanged. On the other hand, overexpression of a dynamic subunit may cause the complex to become constitutively active, which could have disastrous consequences for the cell. Overexpression of dynamic and static subunits of the same complex should thus give rise to different phenotypic effects. This would explain the observation by Lehner and coworkers that subunits of the same complex often have different overexpression phenotypes.

If this hypothesis is true, genes that lead to phenotypic effects when overexpressed should preferentially encode dynamic proteins, i.e. many of the genes should be periodically expressed. In fact, this correlation between overexpression phenotype and cell-cycle regulation was already described by the Hughes, Boone and Andrews labs who originally published the dataset on overexpression phenotypes (for details see their paper in Molecular Cell):

Genes expressed periodically during the cell cycle (de Lichtenberg et al., 2005) were more likely to show an overexpression phenotype (p = 0.017), and in particular, this tended to cause abnormal morphology [p < 10-13] or cell cycle arrest [p < 10-14](Table S3). When the analysis is limited to genes known to function in the mitotic cell cycle, we still find that overexpression of periodically expressed genes is more likely to cause cell cycle arrest (p = 0.008) or abnormal morphology (p = 0.006) than constitutively expressed cell cycle genes (Table S3), indicating that unscheduled expression of genes that are usually expressed periodically often leads to toxicity.

The results of the two papers thus point in the direction that the just-in-time assembly hypothesis can explain the qualitatively differences between knock-down and overexpression phenotypes.

WebCiteCite this post

Analysis: Periodic nucleosome occupancy during the yeast cell cycle

A while back, I found a paper in PLoS Genetics from Jason Lieb’s lab entitled “Cell Cycle-Specified Fluctuation of Nucleosome Occupancy at Gene Promoters”. There is little point in me rephrasing their work, so here is the original abstract:

The packaging of DNA into nucleosomes influences the accessibility of underlying regulatory information. Nucleosome occupancy and positioning are best characterized in the budding yeast Saccharomyces cerevisiae, albeit in asynchronous cell populations or on individual promoters such as PHO5 and GAL1–10. Using FAIRE (formaldehydeassisted isolation of regulatory elements) and whole-genome microarrays, we examined changes in nucleosome occupancy throughout the mitotic cell cycle in synchronized populations of S. cerevisiae. Perhaps surprisingly, nucleosome occupancy did not exhibit large, global variation between cell cycle phases. However, nucleosome occupancy at the promoters of cell cycle–regulated genes was reduced specifically at the cell cycle phase in which that gene exhibited peak expression, with the notable exception of S-phase genes. We present data that establish FAIRE as a high-throughput method for assaying nucleosome occupancy. For the first time in any system, nucleosome occupancy was mapped genome-wide throughout the cell cycle. Fluctuation of nucleosome occupancy at promoters of most cell cycle–regulated genes provides independent evidence that periodic expression of these genes is controlled mainly at the level of transcription. The promoters of G2/M genes are distinguished from other cell cycle promoters by an unusually low baseline nucleosome occupancy throughout the cell cycle. This observation, coupled with the maintenance throughout the cell cycle of the stereotypic nucleosome occupancy states between coding and noncoding loci, suggests that the largest component of variation in nucleosome occupancy is ‘‘hard wired,’’ perhaps at the level of DNA sequence.

Although the authors clearly and very reasonably focus on nucleosome assembly at the promoter regions, their microarray experiments include also probes for the open reading frames (ORFs). I thus decided to take a look at whether nucleosome occupancy within the ORFs correlates with the transcriptional regulation of genes.

I first downloaded the complete dataset from the Gene Expression Omnibus (GEO) database and used a previously described algorithm to identify genes with periodic variation in nucleosome occupancy. The algorithm provides two p-values that tell if a profile varies significantly across time points (“regulation”) and if this variation correlates significantly with a cosine wave with the period of interest (“periodicity”). Finally, it combines the two p-values into a single score (“combined”).

The genes can be ranked according to any one of these three scores. To test which score makes most biological sense, I benchmarked each of the ranked list against a list of 113 genes that are known from small-scale experiments to be transcriptionally regulated during the budding yeast cell cycle (the B1 list from de Lichtenberg et al. (2005)). Below is a plot showing the fraction of the benchmark identified as function of the number of genes identified as having periodic nucleosome occupancy:

Benchmark of periodic nucleosome occupancy vs. known cell-cycle-regulated genes

As should be the case, the curve for the combined score lies above the curves for “regulation” and “periodicity” alone, and all three scores enrich for know cell-cycle-regulated genes relative to random expectation (“random”). A clear break in the “combined” curve is observed at rank 300, after which there is essentially no enrichment for known cell-cycle-regulated genes. I thus decided to base my analysis on the top-300 genes according to the combined score.

Comparing this list to the top-600 periodically expressed genes from de Lichtenberg et al. (2005) revealed an overlap of just 45 genes. This is approximately 50% more than expected by random chance and the difference is statistically significant (P < 0.001; Fisher’s exact test).

The next logical thing to do was to check the timing of expression during the cell cycle for the genes with and without periodic nucleosome occupancy. The temporal expression profile of each periodically expressed gene is summarized in a single number, the peak time, which tells when in the cell cycle the gene is maximally expressed. The unit of the peak times are “percent of a cell cycle”; 0% corresponds to the time of cell division and 40% corresponds to S phase (in budding yeast). I plotted the peak-time distributions as histograms:

Peak-time distribution of of periodically expressed genes with and without periodic nucleosome occupancy

If the two distributions look similar to you, it is for a good reason: according to the Kolmogorov-Smirnov test there is no significant difference. Not a very exciting result, but perhaps also not too surprising.

If the periodic nucleosome occupancy of cell-cycle-regulated genes has a biological imporantance, then one should expect that time of peak expression of a gene corresponds to the time of minimal nucleosome occupancy. I thus made a scatter plot of the two for the set of 45 genes:

Time of maximal expression vs. time of minimal nucleosome occupancy

There seems to be no correlation. A possible explanation is that overlap of 45 genes is only 50% more than expected by random chance; in other words only one in three genes, that is 15 genes, can be expected to contribute to the signal (if there is any). Even if the correlation was perfect these genes, the overall correlation would be difficult to detect.

At this point I decided to drop the project. In summary, the benchmark results and the comparison with microarray expression data show that there is a statistically significant correlation between periodic nucleosome occupancy within an ORFs and periodic expression of the corresponding gene. However, the signal is quite weak and it is thus difficult to get much further.

You are most welcome to post good ideas as comments. Alternatively, I will be happy to provide you with all the files if you want to take over the project.

WebCiteCite this post