Several large kinase inhibitor screens have been published in recent years. Two of the largest come from Stefan Knapp’s lab and Ambit, respectively. The former group used a temperature shift assay to measure the change in thermal stability of 60 human serine/threonine kinases that is caused by the binding of each of 156 kinase inhibitors (Fedorov et al., 2007). The latter group used a competition a competition binding assay to measure the dissociation constants (Kd) for 38 kinase inhibitors and 290 distinct kinases (Karaman et al., 2008).
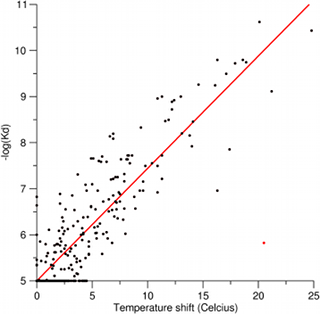
The two screens are not directly comparable because one measures temperature shifts whereas the other measures dissociation constants. To see if it possible to convert temperature shift values to Kd values, I asked Damian Szklarczyk (who is a Ph.D. student in my group) to map all data from both screens onto a common set of chemical and protein identifiers, extract all inhibitor-kinase pairs that were measured in both assays, and make a scatter plot of -log(Kd) as function of temperature shift. The result was a set of 704 pairs of temperature shift and Kd values. In the plot below, inhibitor-kinase pairs for which binding was not observed in the competition binding assay were defined to have a Kd of 10 microM, and negative values from the temperature shift assay were treated as zero temperature shift.

The plot shows that the two assays are in very good agreement, which is surprising considering that the assays are fundamentally very different and were run using different expression constructs for several of the kinases. The linear Pearson correlation coefficient is 0.92 when excluding the one obvious outlier shown in red (BIRB796 vs. MAPK11; this appears to be a false negative in the competition binding assay).
The linear fit gives an intercept with the y-axis of 4.9223, which implies that a temperature shift of zero (i.e. no binding according to the temperature shift assay) does not translate precisely into a Kd of 10 microM (i.e. no binding according to the competition binding assay). We thus did a second linear regression in which we forced the intercept with the y-axis to 5 (red regression line in the plot). We thereby at the calibration function -log(Kd) = 5+0.244*Ts, which allows us to to convert temperature shifts to Kd values. We have thereby managed to put the measurements from the two kinase inhibitor screens onto a common basis that facilitates direct comparison and integration.
Full disclosure: I have an on-going collaboration with Stefan Knapp’s lab related to screening of kinase inhibitor.
 Cite this post
